
2011 Groundhog Day Blizzard: Key Facts
| Storm name | 2011 Groundhog Day Blizzard |
| Dates | January 31 to February 2, 2011 |
| Storm type | Major winter storm and blizzard |
| Areas affected | Central and eastern United States, Southern Ontario and parts of Quebec |
| Main hazards | Heavy snow, powerful winds, blowing snow, whiteout conditions, freezing rain and ice |
| Highest reported snowfall | About 69 centimetres near Antioch, Illinois |
| Chicago snowfall | More than 50 centimetres |
| Storm ranking | Category 5 in the Ohio Valley on NOAA’s Regional Snowfall Index |
| Major impacts | Highway closures, stranded motorists, cancelled flights, school closures and power outages |
| Other names | Groundhog Day Blizzard and Snowmageddon |
The storm affected several regions and reached Category 5 intensity in the Ohio Valley, the highest category on NOAA’s Regional Snowfall Index. Snowfall totals exceeded 30 centimetres across a broad portion of the Midwest, while some locations received more than 60 centimetres.
What Was the 2011 Groundhog Day Blizzard?
The 2011 Groundhog Day Blizzard, also referred o as the Snowmageddon, was one of the most widespread and disruptive winter storms to strike North America in the 21st century. Occurring between January 31 and February 3, 2011, the storm brought heavy snowfall, blizzard conditions, freezing rain, severe thunderstorms, and damaging winds to millions of people across the United States and Canada. At its peak on February 1–2, the storm produced near-whiteout conditions, shut down major cities, and disrupted transportation across much of central and eastern North America.
Named after Groundhog Day, when the storm reached its greatest intensity, the system stretched from Texas to Nova Scotia, affecting more than 30 U.S. states and several Canadian provinces. While the northern side of the storm produced heavy snow and blizzard conditions, areas farther south experienced significant freezing rain, ice accumulation, and even tornadoes. This enormous geographical footprint made it one of the most complex winter storms in modern weather history.
The hardest-hit areas included Illinois, Indiana, Wisconsin, Michigan, Missouri, Oklahoma, Ontario, Quebec, and Atlantic Canada. Chicago recorded 53.8 centimetres (21.2 inches) of snow, its third-largest snowstorm on record at the time, while parts of northeastern Illinois received nearly 70 centimetres. In Canada, Southern Ontario experienced widespread school closures, dangerous travel conditions, and Blizzard Warnings, while heavy snow continued into Quebec and Atlantic Canada.
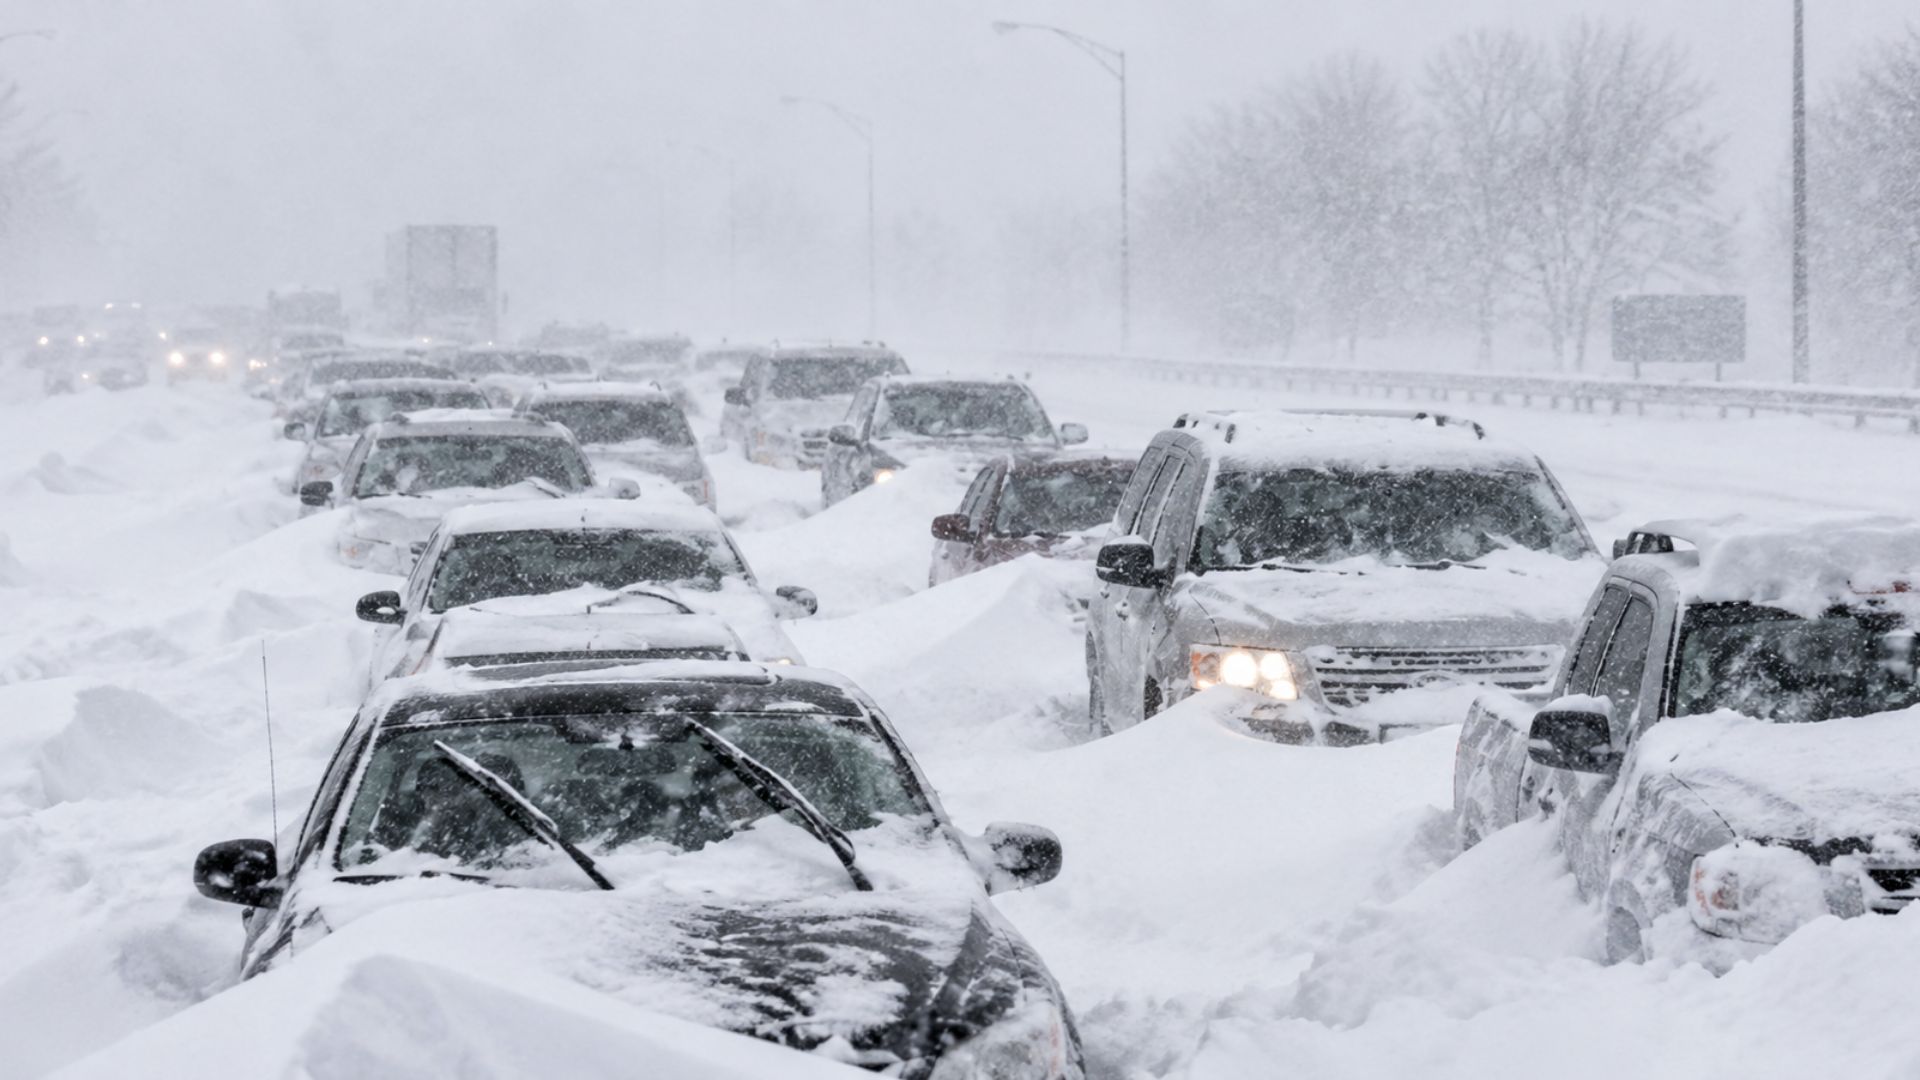
Beyond the snowfall totals, the Groundhog Day Blizzard is remembered for its dramatic impacts. Hundreds of vehicles became trapped overnight on Chicago’s Lake Shore Drive, thousands of flights were cancelled, interstate highways closed, and emergency crews carried out numerous rescues in dangerous whiteout conditions. Across Southern Ontario and Quebec, blowing snow and reduced visibility made travel hazardous, while a 70-vehicle pileup occurred on Highway 20 near Sainte-Julie, Quebec. The combination of heavy snow, strong winds, and widespread disruption resulted in more than US$1 billion in damages, earning the storm a Category 5 rating on NOAA’s Regional Snowfall Index, the agency’s highest classification for winter storms based on intensity, geographic extent, and population affected.
More than a decade later, the 2011 Groundhog Day Blizzard remains one of North America’s benchmark winter storms. Its exceptional size, meteorological complexity, and widespread societal impacts continue to make it a defining example of how a powerful winter cyclone can affect millions of people across an entire continent.
Timeline
The Groundhog Day Blizzard unfolded over four days, evolving from a developing low-pressure system in Texas into one of the largest winter storms to impact North America in decades. As it strengthened and tracked northeast, the storm produced heavy snow, blizzard conditions, freezing rain, severe thunderstorms, and widespread transportation disruptions across the United States and Canada.
| January 31, 2011 | A low-pressure system developed over southern Texas as Arctic air collided with warm, moist Gulf air. Winter storm warnings and blizzard watches were issued across the southern Plains and Midwest. |
| February 1 (Morning) | Heavy snow spread across Oklahoma, Missouri, Kansas, Iowa, and Illinois. Snowfall rates intensified while freezing rain and ice accumulated farther south. |
| February 1 (Afternoon–Evening) | Blizzard conditions developed across the Chicago metropolitan area as winds strengthened and visibility dropped to near zero. Hundreds of motorists became stranded on Lake Shore Drive, and O’Hare Airport cancelled thousands of flights. |
| February 2 (Groundhog Day) | The storm reached the Great Lakes and Southern Ontario. Environment Canada issued Blizzard Warnings for parts of southwestern Ontario as Windsor, Hamilton, and surrounding communities experienced heavy snow and blowing snow. Quebec and Atlantic Canada also began seeing deteriorating conditions. |
| February 3 | The storm exited into Atlantic Canada, bringing heavy snowfall and strong winds to Nova Scotia, New Brunswick, Prince Edward Island, and Newfoundland before moving into the North Atlantic. Cleanup operations began across much of North America. |
January 31: A Powerful Storm Takes Shape
The first signs of the storm appeared on January 31, when a strengthening low-pressure system developed over southern Texas. Meteorologists closely monitored the system as cold Arctic air surged southward behind it while warm, moisture-rich air from the Gulf of Mexico continued flowing north. Forecast models quickly indicated that the storm would rapidly intensify as it moved toward the Mississippi Valley, prompting widespread winter storm and blizzard watches across the central United States.
February 1: Blizzard Conditions Sweep Across the Midwest
By the morning of February 1, heavy snow was falling across Oklahoma, Kansas, Missouri, Iowa, and Illinois. Snowfall rates intensified throughout the day, with many communities receiving 2.5 to 5 centimetres of snow per hour. At the same time, damaging freezing rain accumulated across portions of Arkansas, Tennessee, Kentucky, and the Ohio Valley, while severe thunderstorms and tornadoes developed farther south.
As evening approached, the storm reached its peak intensity around Chicago. Wind gusts approaching 95 km/h (60 mph) combined with heavy snowfall to produce widespread whiteout conditions. One of the storm’s most iconic scenes unfolded along Lake Shore Drive, where hundreds of vehicles, including buses and emergency vehicles, became trapped overnight after traffic ground to a complete halt. Thousands of flights were cancelled, schools closed, and city services were severely disrupted.
February 2: Groundhog Day Brings the Storm into Canada
On Groundhog Day, the storm pushed across the Great Lakes into southern Canada. Environment Canada issued Blizzard Warnings for parts of Windsor-Essex, Chatham-Kent, Sarnia-Lambton, and Middlesex County, marking one of the most significant blizzard events in Southern Ontario in many years.
February 3: The Storm Moves into Atlantic Canada
By February 3, the storm had reached Quebec and Atlantic Canada. Montreal, Moncton, and Charlottetown each received approximately 20–25 centimetres of snow, while Halifax recorded 30.3 centimetres. High winds continued to reduce visibility, creating dangerous driving conditions throughout the region. In Quebec, one of the storm’s most significant traffic incidents occurred when approximately 70 vehicles collided on Highway 20 near Sainte-Julie, highlighting the severe travel hazards created by blowing snow.
Although snowfall gradually came to an end later that day, recovery efforts continued for days across North America as municipalities cleared roads, restored transportation networks, and assessed the storm’s widespread impacts.
Storm Track Across North America
The 2011 Groundhog Day Blizzard affected an enormous portion of North America, stretching more than 3,500 kilometres from Texas to Nova Scotia. While the storm is remembered primarily for its crippling snowfall across the Midwest and Great Lakes, its impacts varied significantly depending on location. Communities north of the storm’s centre endured blizzard conditions and heavy snow, while areas farther south experienced freezing rain, damaging ice accumulation, severe thunderstorms, and even tornadoes.
Its immense size meant that nearly every region along the storm’s path experienced some form of hazardous weather, making it one of the most geographically expansive winter storms in recent history.
Southern Plains: Where the Storm Began
The storm first organized over southern Texas on January 31 before moving northeast into Oklahoma and Kansas. Cold Arctic air rapidly spread southward behind the developing low-pressure system, while warm Gulf moisture surged north ahead of it.
Cities including Tulsa, Oklahoma, received historic snowfall. Tulsa recorded 35.6 centimetres (14 inches), making it the city’s largest snowstorm since weather records began in 1893, according to NOAA’s February 2011 climate report. Farther south, freezing rain coated roads, trees, and power lines with thick ice, causing dangerous travel conditions and scattered power outages.
Midwest: The Heart of the Blizzard
The storm reached maximum intensity as it crossed the Midwest, where Illinois, Indiana, Wisconsin, Iowa, Michigan, and Missouri experienced prolonged periods of heavy snowfall and powerful winds.
The Chicago metropolitan area became the epicentre of the blizzard. Snow fell continuously for nearly 24 hours, accumulating 53.8 centimetres (21.2 inches) at O’Hare International Airport. Wind gusts approaching 95 km/h (60 mph) produced severe blowing snow and whiteout conditions, reducing visibility to near zero. The National Weather Service Chicago storm summary describes the event as one of the city’s most significant winter storms on record.
The most iconic images from the storm came from Lake Shore Drive, where hundreds of vehicles became stranded after traffic came to a complete standstill. Emergency crews spent hours rescuing motorists trapped overnight in freezing temperatures, an event extensively covered by The Weather Network’s retrospective.
Communities farther north, including Antioch, Illinois, recorded the storm’s highest snowfall totals of nearly 69 centimetres (27 inches), aided by moisture from Lake Michigan.
Great Lakes and Southern Ontario
As the storm moved into the Great Lakes on February 2, it spread heavy snow into Southern Ontario.
Environment and Climate Change Canada issued Blizzard Warnings for portions of Windsor-Essex, Chatham-Kent, Sarnia-Lambton, and Middlesex County, warning residents of near-zero visibility caused by blowing snow.
Although Toronto remained on the northern edge of the heaviest snowfall band and recorded 14.4 centimetres, surrounding communities received considerably more.
Some of the highest Canadian snowfall totals included:
- Windsor: 30.2 cm
- Hamilton: 25.2 cm
- Brockville: 26.7 cm
Combined with wind gusts exceeding 70 km/h, these snowfall totals created dangerous driving conditions across southern Ontario. Numerous schools closed, flights were delayed or cancelled, and highway travel became extremely hazardous. The closures and snowfall totals were documented by both CBC News’ original storm coverage and The Weather Network’s retrospective.
Quebec and Atlantic Canada
After leaving Ontario, the storm continued into Quebec and the Atlantic provinces, where heavy snow and strong winds persisted into February 3.
Montreal, Moncton, and Charlottetown each received approximately 20–25 centimetres of snow, while Halifax recorded 30.3 centimetres.
One of the largest traffic incidents occurred on Highway 20 near Sainte-Julie, Quebec, where approximately 70 vehicles were involved in a chain-reaction collision after visibility rapidly deteriorated in blowing snow. The crash was reported by CBC News and summarized in The Weather Network’s anniversary article.
An Exceptionally Large Winter Storm
Unlike many winter storms that primarily affect one region, the Groundhog Day Blizzard produced a wide range of weather hazards across an enormous portion of the continent.
North of the storm track, communities dealt with heavy snowfall, blizzard conditions, whiteout visibility, and massive snowdrifts.
Closer to the storm’s centre and south of it, residents experienced freezing rain, damaging ice accumulations, severe thunderstorms, and tornadoes.
By the time the storm exited Atlantic Canada on February 3, it had affected more than 100 million people, disrupted transportation across thousands of kilometres, and earned a Category 5 rating on the NOAA Regional Snowfall Index—the highest classification for a winter storm based on its intensity, geographic coverage, and population affected.
Snowfall Totals from the 2011 Groundhog Day Blizzard
Snowfall from the 2011 Groundhog Day Blizzard covered a vast corridor from the southern Plains through the Midwest, Great Lakes and eastern Canada. The heaviest accumulations occurred northwest of the storm’s track, where cold air, abundant moisture and strong atmospheric lift supported hours of intense snowfall.
Totals varied sharply between nearby communities. Some locations received more than half a metre of snow, while others near the edge of the main snow band recorded much less than forecast. Wind also made the storm feel more severe than the measured totals alone suggest, as freshly fallen snow was repeatedly blown into deep drifts and across recently cleared roads.
Snowfall Totals in the United States
The storm’s most extreme snowfall occurred across northeastern Illinois and surrounding parts of the Midwest. According to the National Weather Service in Chicago, Chicago O’Hare International Airport recorded 53.8 centimetres, or 21.2 inches, over the three-day event. That made it Chicago’s third-largest snowstorm on record at the time.
Communities north of Chicago received even more. Antioch, Illinois, reported approximately 68.6 centimetres, or 27 inches, which was among the highest totals associated with the storm. Farther west, portions of western Illinois and northeastern Missouri generally received between 48 and 51 centimetres, according to the National Weather Service Quad Cities event summary.
| Antioch, Illinois | Approximately 68.6 cm |
| Chicago O’Hare, Illinois | 53.8 cm |
| Rockford, Illinois | 38.4 cm |
| Tulsa, Oklahoma | 35.6 cm |
| Western Illinois and northeastern Missouri | Up to approximately 48–51 cm |
Tulsa’s 35.6-centimetre total was especially notable because it became the city’s largest recorded snowstorm since local records began in 1893. The historic accumulation was documented in The Weather Network’s retrospective on the storm.
Snowfall Totals in Southern Ontario
The storm reached Southern Ontario during the night of February 1 and into Groundhog Day. Forecasts initially suggested that parts of the Greater Toronto Area could receive a much larger snowfall, but dry air reduced accumulations in and around Toronto.
Toronto Pearson International Airport ultimately measured 14.4 centimetres. Heavier totals occurred both southwest and east of the city, including 30.2 centimetres in Windsor, 25.2 centimetres in Hamilton and 26.7 centimetres in Brockville. These Canadian totals were reported in The Weather Network’s historical review.
| Windsor | 30.2 cm |
| Brockville | 26.7 cm |
| Hamilton | 25.2 cm |
| Toronto Pearson | 14.4 cm |
Toronto’s lower-than-expected total did not mean the storm had little impact. The threat of heavy snow and dangerous travel led to the city’s first widespread public school closures since the major Toronto snowstorms of 1999. Elsewhere in Southern Ontario, stronger winds and heavier snow produced drifting, reduced visibility and hazardous highway conditions.
Snowfall Totals in Quebec and Atlantic Canada
The storm continued east into Quebec and Atlantic Canada, where many communities received another substantial round of snow.
Montreal, Moncton and Charlottetown generally recorded totals of approximately 20 to 25 centimetres. Halifax received 30.3 centimetres, while some nearby parts of Nova Scotia reportedly approached or exceeded 38 centimetres.
| Halifax, Nova Scotia | 30.3 cm |
| Montreal, Quebec | Approximately 20–25 cm |
| Moncton, New Brunswick | Approximately 20–25 cm |
| Charlottetown, Prince Edward Island | Approximately 20–25 cm |
| Parts of the Halifax area | Up to approximately 38 cm |
The combination of snow and strong winds caused widespread closures and travel difficulties across eastern Canada. The reported totals for Montreal, Moncton, Charlottetown and Halifax are summarized in The Weather Network’s Groundhog Day Blizzard article.
Why Snowfall Totals Varied So Much
The differences in snowfall were largely determined by the precise path of the low-pressure centre, the position of the heaviest precipitation bands and the amount of dry air entering the system.
Locations beneath persistent bands of heavy snow accumulated rapidly, particularly where snowfall rates reached several centimetres per hour. Areas closer to the edge of the storm experienced shorter periods of snow or interruptions caused by drier air. This is why Chicago and northeastern Illinois received more than 50 centimetres, while Toronto recorded less than 15 centimetres despite earlier expectations of a much larger storm.